


Connectors suffer from many EMC problems due to they can be considered as short length conductors with a rigid body. Sometimes it is difficult that manufacturers ensure a 360º shielding in the connectors because it depends on the many factors such as case shielding, number of grounded pins or spring length.
Thereby, connectors are an important factor to take into account from the EMC design point of view even if they are not in use because they can amplify the internal system noise to outside like an antenna. In order to avoid this issue, connectors should be properly shielded and a possible solution could be to place sealed caps in the open interfaces. Thus, the effectiveness of shielded caps is going to be evaluated in this document through testing a device which holds a D-SUB connector due to rectangular connectors often show more EMC problems.
Many devices have D-SUB connectors to interface computers or systems with others peripherals. A D-SUB connector have two or three parallel rows of contacts generally surrounded by a metal shield with “D” shaped that provides mechanical support and protection against electromagnetic interference. Nevertheless, this metal case sometimes does not avoid interference on this type of connectors when they have nothing connected. Therefore, the objective of this test is to evaluate the D-SUB-RF-SEALED Cap solution manufactured by Würth Elektronik and designed to protect against RF influence in this kind of interface.
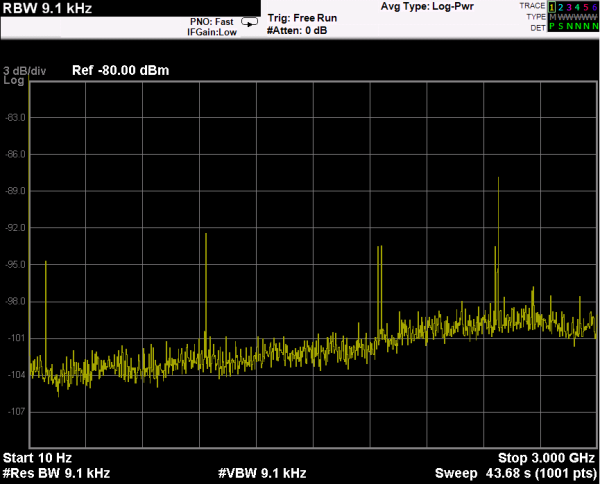
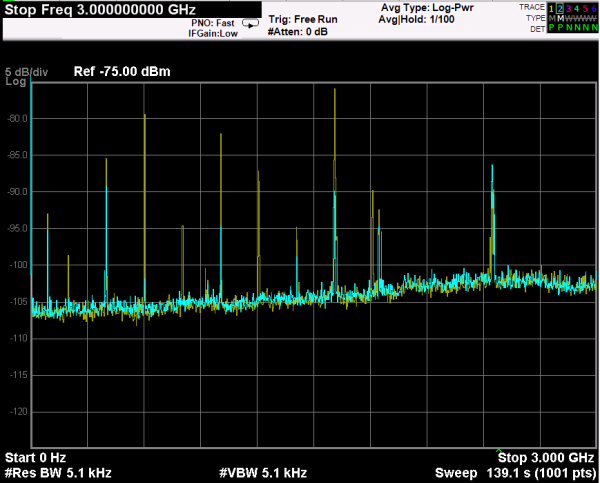
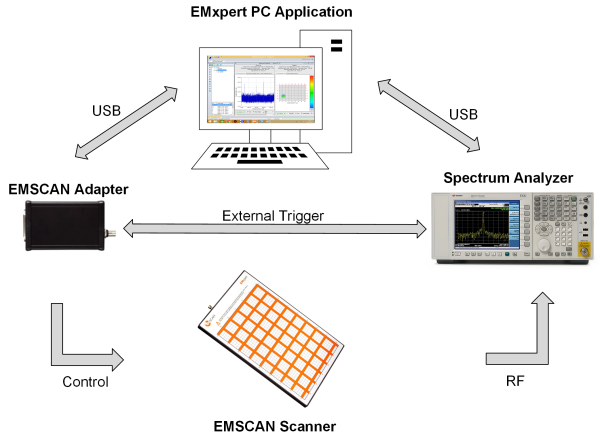
A spectrum analyzer capable of measuring signals from 10 Hz up to 3 GHz and a Würth Elektronik near field probe has been used to evaluate the D-SUB-RF-SEALED CAPS in a system designed to generate radiated and conducted emissions in a metal enclosure. The test will be held by attaching the near field probe close to the connector and measuring the noise emitted in the full spectrum analyzer frequency range. Next, the test will be done with the cap placed in the connector.
Both measurements will be acquired with the max hold option enabled in order to compare them and to able to find the noisiest frequency range. Once this range is detected, it will be analyzed with more detail by zooming in that frequency range.
An electromagnetic scanner module has been also employed in this test to evaluate the effectiveness of D-SUB caps. This is formed by a precise near field probe arrays and it is able to detect the magnetic field information in all directions with the spectral / spatial scanning feature. It can scan a frequency range for the selected region and measure the radiation situation in the whole frequency band of each spatial location to get the full electromagnetic information.
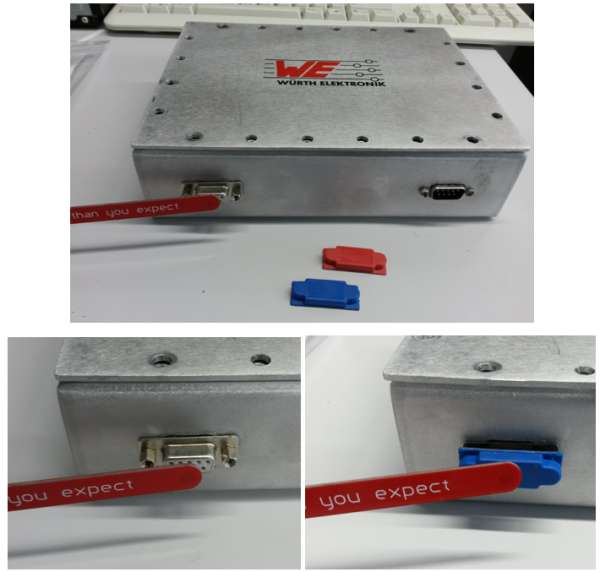
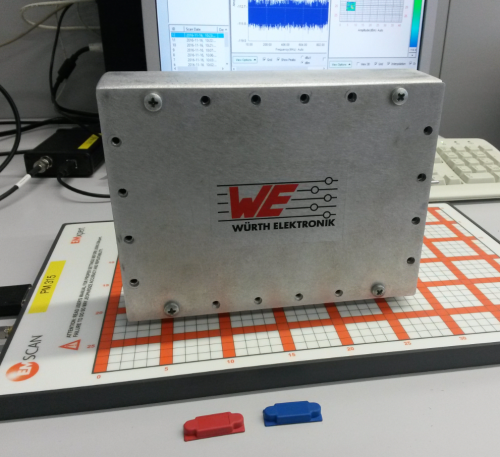
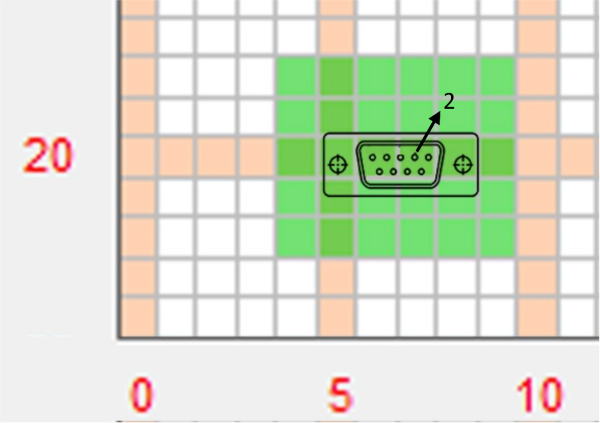
The device that will be under test is the EMC Box which generates high-frequency pulses through an internal oscillator circuit. The output signal is connected to 2 pin of the D-SUB female connector placed in the box front side. The connector case is joined with the shielded metal enclosure and the oscillator circuit GND plane. This device allows characterize female connector taking it as the worst case due to pins of male connector usually generates more emissions.
The setup employed to carry out this second experiment is based on the D-SUB EMC Experiments Box connector. The test has been performed with the internal oscillator on and with the external cable unplugged.
With regard to the frequency range and acquiring parameters, the test has been performed by selecting a start frequency of 10 MHz and a stop frequency of 100 MHz due to the main noise components are concentrated in that range. In order to obtain a great balanced between scan time and resolution a RBW of 30 KHz has been set.
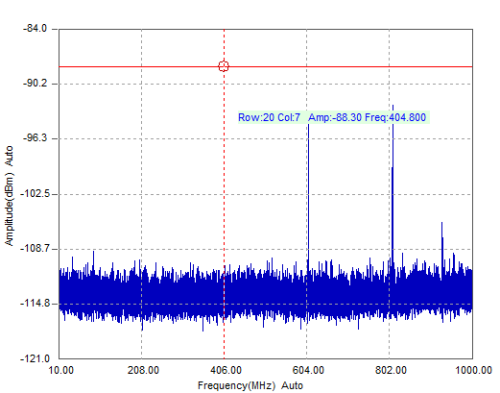
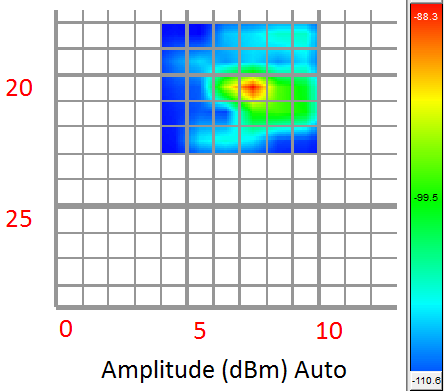
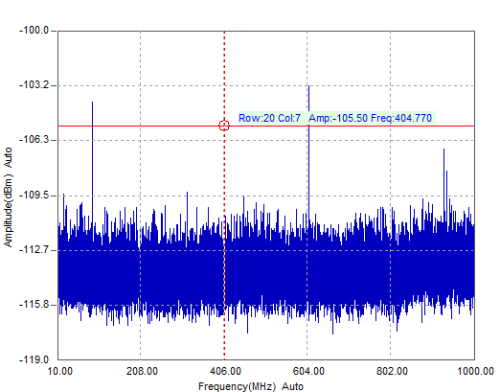
The first test carried out shows the spectral of the signal measured in the selected EMSCAN area. By viewing the spectral capture, the maximum peak corresponds to 404,8 MHz, with an amplitude of -88,3 dBm that is to say, 26 dBm higher than the base noise level. Another data that provides this capture is the special position of this measure in the EMSCAN: row 20 and column 7.
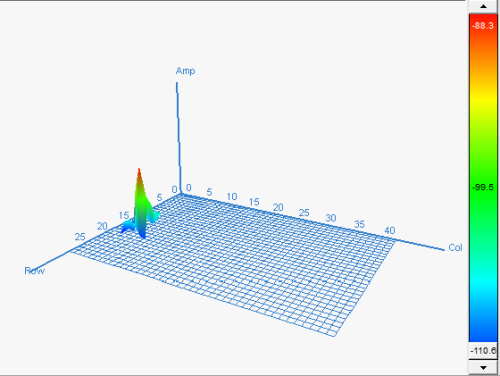
Figure 10. Spatial radiation diagram without shielding.
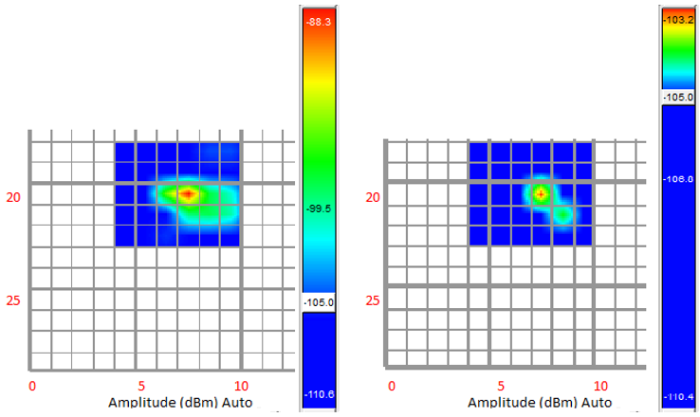
Once the electromagnetic noise of the EMC Experiment Box D-SUB connector has been studied, the D-SUB-RF-SEALED CAP is placed in the connector and the same measurements will be repeated to evaluate its performance.
Now, the spectral capture shows a large reduction of the maximum peak. If the last maximum peak located in 404,8 MHz is compared after placing the shielded cap, it is possible to view that the amplitude level has been attenuated 17,2 dBm. Figure 13 illustrates the spectral measured with the shielded cap placed in the D-SUB connector and the maximum frequency peak.
Therefore, the effect of D-SUB-RF-SEALED Caps has been evaluated in this test through measuring the electromagnetic noise emitted in a D-SUB connector. The EMC Experiments box based on an oscillator circuit placed inside a metal enclosure has been used as noise source and it has been connected to an external D-SUB connector.
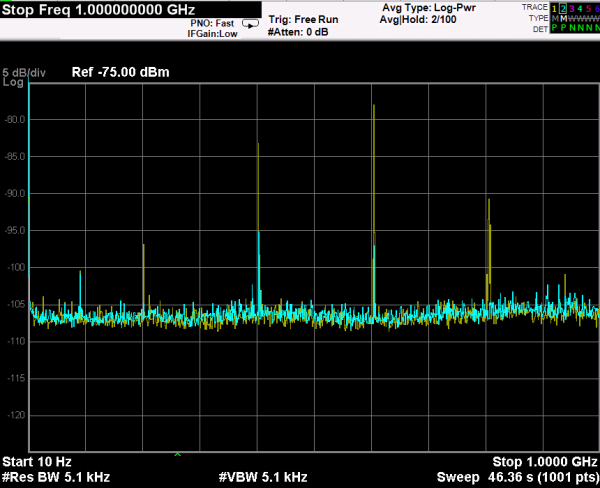
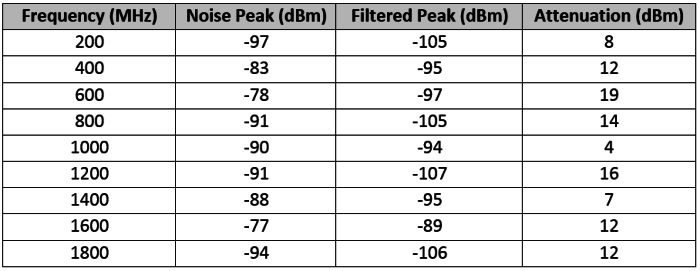
Considering the measurements taken with the EMC scanner and the Spectrum Analyzer before and after placing the shielded cap, both measurements shows an attenuation higher than 10 dBm in the maximum peak placed around 400 MHz in the EMC Box tests. Furthermore, it also has demonstrated a large attenuation in the rest noise peaks in the frequency range analyzed (10 – 2000 MHz).
The complete document with more information about this experiment can be downloaded here.